 © Petr Machacek, Unsplash
Agile Corporate Performance Management in the Call Center Example
Many companies use call centres to offer their customers the best possible customer service, to expand telephone sales or to be able to offer other services. Call centres are often criticized for not being efficient enough and for missing cost or contribution margin targets. Therefore, an intensive analysis of optimization potentials is worthwhile. Efficiency improvements can be brought about in a variety of ways – in this example we present a value driver model that can be used to analyze financial improvement opportunities and thus show an example of agile corporate performance management.
Less Effort Through the Use of Value Driver Models
Value drivers have the character of operational levers. They enable financial (corporate performance) management at a higher level. The focus is no longer on many details, but rather only essential influencing factors are included. In the context of financial planning, value driver models can be used to derive goals directly from the corporate strategy. Through the additional integration of (strategic) measures, options for action and their effect on important financial targets are shown transparently. The structure of a value driver tree is quickly explained. It consists of data, operators and KPIs (key performance indicators):
- The data have, each data element for itself, characteristic values. These can be time, location, product type or other classifications. Based on these characteristics, the data is arranged in a table and can be viewed separately or aggregated.
- In the operators, the data is processed according to the corresponding specification. Typical mathematical operations that are performed are additions and multiplications. However, more complex relationships are also possible, which are described with formulas.
- The target values of a driver model (KPIs), are calculated from the data elements and the operators. You can then easily have the result output.
Basically, there are different ways to construct such a driver model. These include common financial planning and BI solutions, as well as Microsoft Excel. Depending on the complexity of the model, characteristics or scope of data, these tools only fullfil the purpose to a limited extent. Flexibility (in case of change requests in the model), transparency (of the calculation logic and the interaction between inputs and results) and agility (when calculating different alternatives) often fall by the wayside. Implementation is time-consuming and there is no time for the essential aspects of the "exercise": defining goals and forecasts, evaluating and analyzing options for action, discussing scenarios.
Transparency and Clarity Through Simulation Software
For a company in the telecommunications industry, we have designed a business model-specific driver tree and implemented it in our software for agile corporate performance, Valsight, to support simulations in planning. Below, we outline the individual steps involved in this process.
Step 1: Define the Most Important Drivers and Analyze the Key Performance Indicators (KPIs)
In this business case, a typical call center was modeled in Valsight. The logic of the model is explained as follows:
- Sales capacity: There is a specific number of calls that need to be handled. This is determined by the contracts negotiated with customers.
- Resource capacity: The capacity is limited to a certain number of calls that can be handled by the workforce.
The resource capacity is "driven" by the following two value drivers:
- Staffing: The number of call centre agents employed by the call centre
- Calls per agent: The average number of calls a single agent can complete
Both drivers are influenced by certain factors. For example, the number of calls that an agent can handle can be increased through training sessions on efficient customer communication. With improved skills, the agent can access the necessary information more quickly and therefore move on to the next call faster.
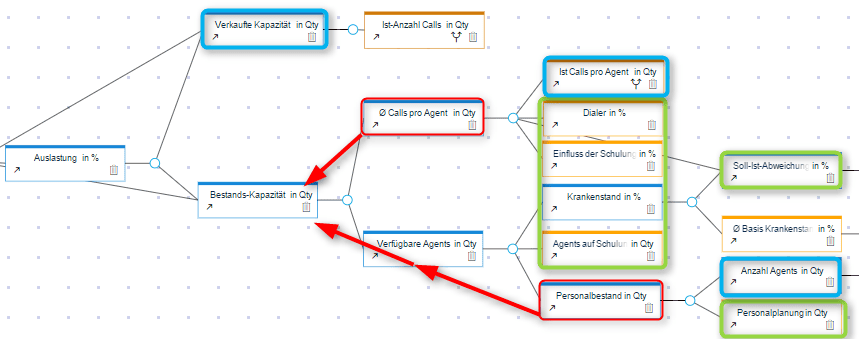
 Fig. 1: Valsight model editor with representation of the most important drivers (red), their influences (green) and some basic values of the model (blue)
The main driver in the present model is the workforce. On the cost side, this position determines the size of the office, the electricity consumption, the office supplies costs, etc. Increasing the number of call center agents will raise these cost items. On the revenue side, it drives the capacity sold to generate revenues.
The basic workforce is adjusted in the system under "Workforce Planning." This figure is influenced by sick leave. Additionally, agents are not available for calls during their training sessions. This results in an actual workforce, referred to as "Available Agents."
The sick leave as an influencing factor, in turn, is influenced by the "Target vs. Actual Deviation," which is the relationship between the number of minutes currently allocated to agents per call and the number of minutes they will be allowed to allocate in the future. If the pressure on employees is increased by reducing the number of minutes allocated, the average number of calls an agent can handle will increase, increasing the capacity and ultimately the revenues. However, this increased pressure on employees also leads to an increase in sick leave as agents cannot withstand the pressure in the long run, reducing the capacity again.
Such multilateral relationships are difficult to represent in a spreadsheet solution like Excel. In a driver-based model, they can be explained quickly and easily understood.
From the "Sold Capacity" and the "Available Capacity," a first KPI can be derived: "Utilization." Utilization measures and indicates the efficiency on the revenue side, ideally always being exactly 100%. This can be explored through the other drivers and their influences.
Step 2: Analyse Effects of Changes in Important Influencing Factors
For example, if the workload is 110%, this means that there are more calls than the agents can handle. There are several options to change this:
- Adjust the default call duration. However, this can reduce capacity again at the same time due to the resulting increased sick leave.
- Recruit staff. This increases the existing capacity, but involves an investment.
- Training measures for the agents. However, the effects are comparatively small, costs are also incurred and the agents are not available in the short term. This would first cause a further drop in the available capacity before it increases.
The measures to be taken and the exact effects can be defined in the so-called scenario manager and analysed in various diagrams.
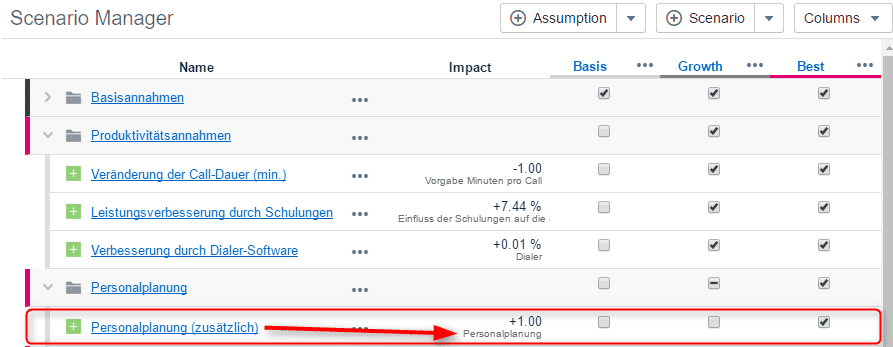
 Fig. 2: The Valsight Scenario Manager incl. assumptions (baseline assumptions, productivity assumptions, workforce planning) and scenarios (base, growth, best)
Assumptions can be added at any time with a few clicks. Each assumption group (here e.g. "Personnel planning") contains sub-items (like here „Personalplanung (zusätzlich)“), which describe the change of individual elements in the model.
- Each sub-item has a reference to an element in the model. In the case of this line item, it is the income statement item "Personnel planning".
- The individual sub-items can be activated or deactivated for the different scenarios.
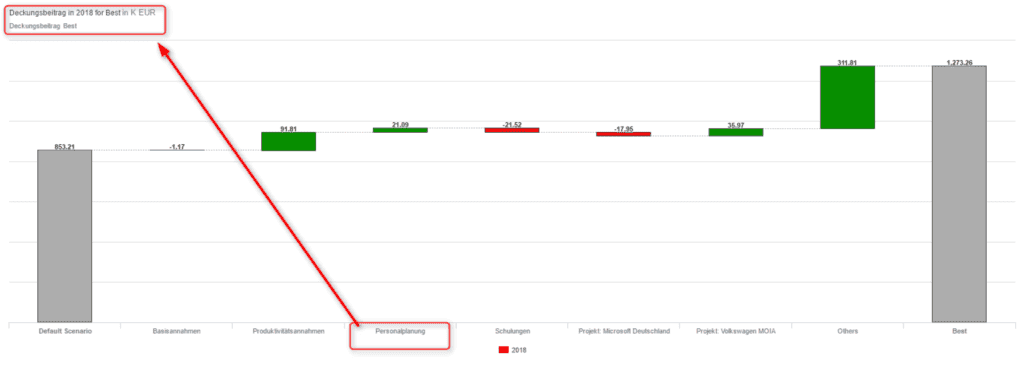
In the corresponding scenarios, the underlying base data and the data entered in the assumptions are active. When these assumptions are changed, they automatically flow through the selected element, as shown in Fig. 3, into the driver model. In combination with the operators (calculation formulas), KPIs and other dependent elements are calculated through the model logic. For example, a personnel increase automatically affects both costs and revenues. The extent of this impact and whether the result will be positive or not depends on the driver tree, which reflects the business model of the company.
Subsequently, the simulated scenarios can be analyzed in various forms of reporting, such as line charts, bar charts, or tables. To visualize the impact of individual assumptions on a specific metric, a variety of charts can be selected. Here, for example, we are using an Assumption Bridge to separately display the effect of adjustments in workforce planning on the contribution margin for the year 2018. This approach makes planning actions under specific assumptions very clear, simple, and transparent.
 Fig. 3: Assumption bridge
But it is not only medium- or long-term financial planning that can be optimised with value-driver-based software solutions such as Valsight. Simulation solutions for planning new business models and calculating business or investment cases can also be set up quickly. Business cases in particular, in which different possible development routes are to be compared, can be presented quickly and clearly with the help of scenarios and assumptions to enable direct comparison and thus facilitate decisions. The example shows how agile corporate performance management can be implemented with Valsight.


